
How to Compute and Trade the SPX Gamma Flip Level
Compute the SPX gamma flip from strike-level open interest, IV, and spot, then confirm a break with acceptance, flow, and net GEX before acting.
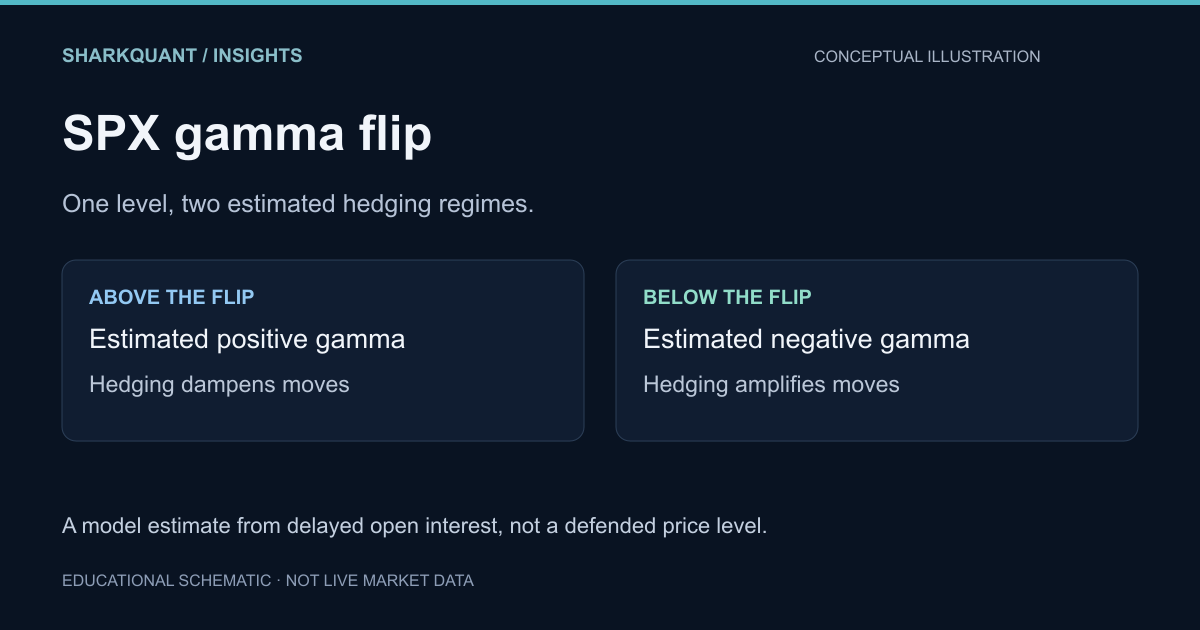
You can compute the SPX gamma flip level yourself from raw option chain gamma, plot it in TradingView, and trade it with fixed entry and invalidation rules, without relying on a dashboard's delayed read. This guide walks through the data inputs, recalculation timing, a confirmation checklist for real flips versus noise, and the exact trade rules.
The gamma flip matters because it changes how the same price action behaves. Above it, hedging tends to dampen moves. Below it, hedging tends to amplify them. That is a statement about an estimated hedging bias, not a promise about direction.
Key takeaways
- The gamma flip level is the spot price where estimated aggregate dealer gamma crosses from negative to positive, changing whether hedging tends to suppress or accelerate intraday moves.
- You can compute the flip yourself from five inputs: strike-level open interest, spot price, per-strike implied volatility, the contract multiplier, and expiry weighting.
- Open interest updates once daily after the exchange close, so intraday flip estimates rest on estimated open interest plus changing spot and implied volatility.
- Confirm a real flip with a 15-minute hold beyond the level plus flow corroboration; two of three checks (acceptance, flow, net GEX) is the minimum to act.
- The SPX flip is the cleaner market-wide regime read, while SPY and single-name flips are noisier and mostly tactical.
What is a gamma flip level and why does it change intraday behavior?
The gamma flip level is the spot price where aggregate dealer gamma crosses from negative to positive (or the reverse). Above it, dealers hold positive gamma and hedge by selling rallies and buying dips, which suppresses volatility. Below it, dealers hedge by buying strength and selling weakness, so moves accelerate and intraday ranges expand.
That mechanism is why the same price action behaves differently on either side of the flip, and why 0DTE traders watch it as a regime boundary rather than a line to trade blindly. We covered the mechanics in Reading the Gamma Flip.
One practical caveat: open interest updates once daily on the exchange side, per Cboe's options education resources, so intraday flip estimates rest on that morning's open interest.
Two more limits belong in the same breath. The flip is a model output: it assumes a dealer sign convention and aggregates positions you cannot see directly. And it is a level, not a wall. Nothing forces price to respect it.
What data do you need to compute a gamma flip level yourself?
You need five inputs: strike-level open interest, spot price, per-strike implied volatility, the contract multiplier, and a way to weight expiries. The formula behind this is covered in gamma exposure explained, but the inputs are the bottleneck, not the math.
Open interest and why delayed OI is usually fine
Cboe publishes daily open interest per strike with a lag, and open interest resets once a day at the exchange level. Intraday volume shifts positioning, but for a same-day flip estimate, yesterday's open interest plus today's volume gets you close. Where you need freshness is expiry weighting on 0DTE, since a same-day expiry's gamma contribution collapses as the session ages.
IV and rate inputs
Per-strike implied volatility comes from your data feed or an options chain snapshot. A flat IV assumption distorts the flip level; strikes near the money matter most, so prioritize accuracy there. Use the risk-free rate for deep in-the-money puts.
Vendor data versus raw exchange files
- Delayed exchange open-interest files. Daily, lagged, free and auditable, but they require a pipeline.
- Paid data feeds. Fresher and usually broader, at a cost that varies by vendor and entitlement.
- Vendor dashboards. Precomputed, low effort, and priced per vendor; check each vendor's current pricing page rather than relying on a summary.
Raw files are free and auditable but require a pipeline. Dashboards such as SpotGamma or Unusual Whales do the aggregation for you. SharkQuant bundles the inputs and the computation so you can check the flip against your own script, and its AI reads state the invalidation condition next to the level.
How do you plot and update a gamma flip level in TradingView?
Option 1: manual horizontal line from your GEX tool
Pull the flip level from your dashboard, then use the horizontal line tool at that price. Rename the line with the calculation timestamp so you know how stale it is. This takes under a minute but breaks down if the level moves mid-session.
Option 2: Pine Script with imported values
The repeatable version is a small Pine Script that reads the flip level from an input field and plots it with hline() or plot() as a step line, so a new value draws a fresh segment instead of overwriting the old one. Add a label showing the price and the time it was last set, and color the background differently above and below the level so regime changes are visible without reading numbers.
You can extend the script to accept daily values pasted from your tool's export, building a history of flip levels you can review against later sessions. Pine's input and plotting functions are documented in the Pine Script reference, and the whole setup takes an afternoon. SharkQuant's AI agents push computed levels so you skip the manual paste.
Refresh timing that matches OI updates
Open interest only updates once daily after the exchange close, so intraday recalculation runs on estimated open interest plus changing spot and implied volatility. Re-plot at the open, after 10:30 ET, and after any 20-point SPX move; otherwise your line is showing a stale positioning estimate.
How often does the gamma flip level move intraday and when should you recalculate?
The flip level is not a fixed line; it drifts as open interest and hedging change. Recalculate at three points: the overnight open-interest reset (new chain data posts before the open), shortly after the 9:30 ET open once the first flow prints settle, and midday when cumulative sweeps and blocks have shifted net GEX enough to move the flip.
On expiry days the schedule compresses. 0DTE contracts dominate the same-day chain, so new prints reprice estimated positioning within minutes, and the flip tends to pull toward the pin as the session ages. If you trade the afternoon 0DTE window, recalculate every 30 to 60 minutes rather than relying on the morning number.
Vanna-driven flows add a second-order drift on top of gamma. Delta can change even when spot does not; the mechanics are in vanna and charm explained.
How do you confirm a flip has actually occurred rather than noise?
Acceptance versus wick: the 15-minute rule
A spike through the flip level that reverses within a few minutes is a wick, not a flip. Require price to hold beyond the level for a full 15-minute candle close. If the next candle reopens back on the original side, treat the break as failed and stand down.
Flow corroboration with sweeps and blocks
Price alone lies; flow confirms. Look for aggressive sweeps crossing the tape in the direction of the break, plus at least one sized block print near the level. If dealer positioning data shows net GEX actually flipping sign on your tool, that is your third check. Two of three (acceptance, flow, net GEX) is the minimum to act.
When the flip level itself is unreliable
Near expiry, the flip level can move faster than you can recalculate it, especially on heavy 0DTE days when strikes roll off. If your level has shifted more than once in the last hour, treat it as provisional and widen your invalidation. Skew shifts distort the calculation too; see volatility skew explained for why the input matters as much as the price action.
What entry and invalidation rules work around a gamma flip point?
Two templates cover most setups. Both assume you have already confirmed the flip is real, not a recalculation artifact.
Template A: fade back to the flip
In a high positive net GEX regime, price gravitating back to the flip level is a mean-reversion fade, not a trend entry. Enter a short-dated put or call spread when price closes back through the flip after tagging the call wall, targeting the put wall.
Invalidation: two consecutive 5-minute closes beyond the flip in the direction of the fade, or a positioning update that flips net GEX sign. Exit, do not average.
Template B: trade the flip as a breakout
After a confirmed flip from negative to positive GEX, buy the first pullback that holds the flip level, with the target at the call wall.
Invalidation: a single 5-minute close back below the flip. Gamma regimes decay fast into the close, so cut Template B entries after roughly 2:30 PM ET unless expiry flows support them.
Writing the invalidation before entry
Decide the exit condition first, in writing, and size to survive it. If you cannot state the invalidation in one sentence, the setup is not defined enough to trade. The same discipline applies to every level on the page; a wall is context, not a guarantee, as what a wall is explains.
How does the SPX gamma flip differ from SPY or single-name flips?
SPX settles in cash, so dealers never face share delivery and pinned strikes behave differently than on equity options. SPY settles in shares, which matters on 0DTE when expiry-hour hedging can force actual stock trades.
Open interest concentration also differs: SPX open interest clusters in large, sticky strikes, while SPY open interest spreads across many near-the-money lines plus the weekly 0DTE crowd.
Practically, the SPX flip is your cleaner regime read, since its positioning reflects a broad institutional book. The SPY flip is noisier but maps directly to the liquidity your 0DTE fills depend on. Single-name flips are mostly idiosyncratic and rarely useful as market-wide regime context. The settlement and exercise differences are covered in SPX vs. SPY 0DTE options.
What are the common mistakes traders make trading the gamma flip?
Five failure modes account for most blown trades around the flip.
First, treating the flip as support or resistance. It is a hedging-incentive boundary, not a price level dealers defend. The mechanism is dealer gamma hedging and the sign change in net GEX, not an order wall.
Second, stale open interest. Open interest updates overnight, so a flip computed on yesterday's open interest drifts as the day passes.
Third, ignoring implied volatility. A vol crush or spike revalues every strike's gamma and moves the flip without price moving.
Fourth, trading every wick through the level. One clean break with volume and a retest beats five faded pokes.
Fifth, confusing call and put walls with the flip. Walls mark strike concentrations; the flip marks where the estimated hedging direction changes. They rarely coincide.
Which tools show the gamma flip level, and how do they compare?
- SpotGamma is a reference point for net GEX and flip levels, with dashboards built around dealer positioning rather than scripting or API pulls.
- Unusual Whales and Cheddar Flow lead on flow detail, sweeps and unusual prints, and treat gamma levels as a secondary layer.
- DSGEX focuses narrowly on dealer positioning and gamma levels.
- Market Chameleon sits adjacent, stronger on historical options statistics than on intraday flip display.
SharkQuant pairs flip level, call wall, and put wall with AI-written reads that state the invalidation condition next to every level, at $29.99-$49.99 for Core and Pro, with a lower Heatmap tier at $16.99.
Where it falls short: there is no public API for pulling flip levels into your own scripts, the dark-pool view is a recorded sample rather than a live print feed, and the track record is shorter than the established vendors'. If your workflow is script-first, that gap matters more than the price difference.
FAQ
Is the gamma flip level the same as the gamma flip knife?
The knife is a nickname some traders use for the flip level itself, but usage varies. Some mean the exact spot where net GEX crosses zero, others mean a looser zone where hedging behavior changes. Since the terms are not standardized, check what a given tool actually plots before assuming the two labels describe the same calculation.
Can I get a free gamma flip indicator for TradingView?
Not directly, since TradingView has no native gamma data. The free path is scripting: pull strike-level open interest from the exchange's delayed files, compute net GEX yourself, then paste the flip level into a simple Pine Script input that plots it as a line. Community scripts exist, but most assume you supply the value rather than computing it inside Pine.
What time does the gamma flip level update each day?
The underlying open interest resets once daily after the exchange close, so a fresh flip level based on new open interest is available before the 9:30 ET open. Intraday recalculations run on estimated open interest plus changing spot and implied volatility, typically at the open, after 10:30 ET, and after any 20-point SPX move.
How accurate is the gamma flip level as support or resistance?
It is not support or resistance at all. The flip marks where estimated dealer hedging incentives change sign, not a price level anyone defends, so price can slice through it repeatedly without consequence. Treat it as a regime boundary: expect suppressed ranges above it and accelerating moves below it, and demand confirmation before acting on any single break.
This article is educational and descriptive. It is not investment advice, and it does not predict prices. Gamma exposure and flip levels are model estimates built from delayed open interest and assumptions about dealer positioning.