
How to Calculate Gamma Exposure: SPY Walkthrough
Rebuild SPY gamma exposure from a raw option chain: per-strike gamma, open interest, dealer sign, the gamma flip and the walls, on one real snapshot.
Key takeaways
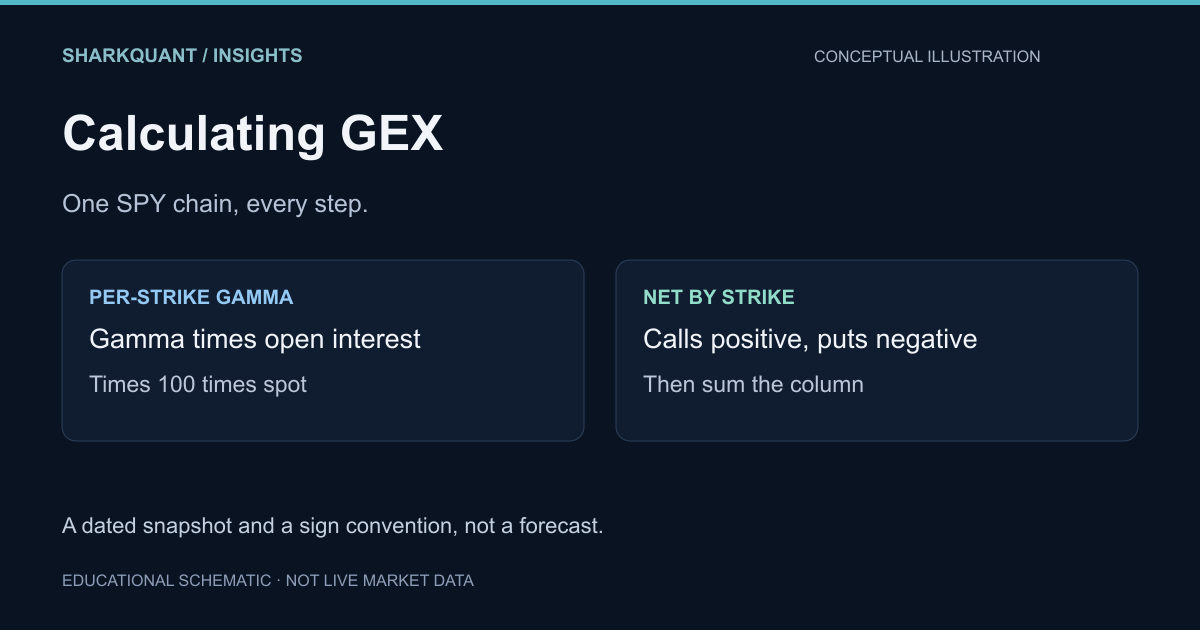
- Gamma exposure is per-contract gamma multiplied by open interest, the 100-share contract multiplier and spot, signed positive for calls and negative for puts, then summed by strike. That gives dollars of delta to hedge per 1-point move; multiply by spot and 0.01 for the per-1% convention.
- The gamma flip is the spot level where net dealer gamma crosses zero. Find it by repricing the whole chain across a grid of hypothetical spot prices, not by scanning one strike column.
- Call and put walls are the strikes with the largest positive and negative GEX. They mark where modeled hedging flows concentrate, not guaranteed support or resistance.
- Per-strike implied volatility matters because gamma scales with 1/IV. On the snapshot below, one ATM IV across the chain moved net GEX by 15.5% and the wall magnitudes by 5% to 8%, without moving either wall strike.
- Intraday GEX is the last published open interest repriced under today's spot and volatility, because exchange open interest only updates overnight. It is a repricing, not new positioning.
You can verify any vendor's gamma exposure numbers in a spreadsheet: pull the option chain, compute per-contract gamma, multiply by open interest, the 100-share multiplier and spot, weight calls and puts by dealer direction, then sum by strike. This walkthrough carries one real SPY chain through every step so you can audit net GEX, the gamma flip and the walls yourself.
The snapshot is SPY at its October 26, 2026 close of $765.37, using the October 30, 2026 expiry and a chain whose greeks carry a 20:00 ET timestamp that evening. Every number below comes from that chain. It is a dated worked example, not a live reading.
What is gamma exposure in options and why does dealer hedging depend on it?
Gamma exposure (GEX) estimates the net gamma dealers hold across an options chain, measured in dollars of delta they would need to trade per 1-point move in the underlying. It comes from per-contract gamma multiplied by open interest and the contract multiplier, summed by strike. You can pull the raw chains and open interest yourself from a broker API or Cboe's delayed quote pages.
The hedging mechanism is mechanical, not predictive. Under the standard dealer-positioning assumption, dealers are long calls and short puts: the call side contributes positive gamma, where hedging sells into rallies and buys dips, and the put side contributes negative gamma, where hedging sells weakness and buys strength. Where net gamma crosses zero, the gamma flip, the sign of that flow changes. That is why the flip and the call and put walls matter intraday.
We publish our own read of these levels at SharkQuant GEX. The rest of this piece rebuilds the number from scratch so you can audit any dashboard against it.
What inputs do you need for a gamma exposure calculation?
Six inputs, all strike-level: open interest, spot price, implied volatility, days to expiry, the contract multiplier (100 for SPY and SPX), and the option's type and strike. With those columns in a spreadsheet you can reproduce any GEX number a vendor shows you. The conceptual walkthrough lives in our gamma exposure explainer.
Where to get options chain data
Your broker's API is the fastest source with open interest attached. Schwab's trader API and IBKR's TWS API both return full chains with open interest and implied volatility, and most brokers let you export a chain as CSV. Cboe publishes delayed quote chains for SPX and SPY.
Delayed data is fine for building the calculation. It is not fine for trading 0DTE off it, because a stale open-interest snapshot shifts both the flip and the walls. Whatever the source, record the timestamp on the chain, not just the date.
Why per-strike IV matters more than a single ATM IV
Gamma scales roughly with 1/IV, so a 30-delta put at IV 25 and a far-OTM put at IV 40 contribute very different dollar gamma even at the same open interest. Using one ATM IV across the chain systematically misweights the wings, which is one reason two vendors' call and put walls can land on different strikes.
Here is the size of that error on the snapshot below. Repricing every strike at the 16.87% ATM IV instead of its own quoted IV moved net GEX from -$594.9M to -$502.5M per point, a 15.5% change. It moved the call-wall magnitude from $31.2M to $33.8M and the put wall from -$238.9M to -$251.3M.
On this chain the two wall strikes stayed at 780 and 755, so the flat-IV effect showed up as a magnitude problem before a level problem. What did change was the margin: the top two call strikes were 0.8% apart using per-strike IV and 14% apart using one ATM number. A steeper skew can reorder them. Pull IV per strike and per expiry, or your audit will disagree with every dashboard for reasons you cannot see.
How do you compute per-strike gamma exposure from open interest?
The Black-Scholes gamma formula in plain terms
Gamma is the rate of change of an option's delta with respect to the underlying price. Under Black-Scholes, for a call or a put:
Γ = φ(d₁) / (S · σ · √T)
where d₁ = [ln(S/K) + (σ²/2)T] / (σ√T), φ is the standard normal density, S is spot, K is strike, σ is implied volatility in decimal form, and T is time to expiry in years. Gamma is identical for a call and a put at the same strike and volatility.
Per contract, in dollars of delta per 1-point move:
GEX_contract = sign × Γ × OI × 100 × S
with sign +1 for calls and -1 for puts under the standard dealer assumption. Sum those across strikes and you have net GEX. To express the same total as dollars per 1% move, multiply by S × 0.01. At $765.37, that turns -$594.9M per point into -$4.55B per 1%.
This walkthrough sets rates and dividends to zero. Over four days that changes the 765 gamma by 0.08%, far inside the quoted-IV error, which is why the short-dated convention is safe here.
Step 1: pin the snapshot
- Underlying: SPY, spot $765.37 at the October 26, 2026 close.
- Expiry: Friday, October 30, 2026. Four calendar days, so T = 4/365.
- Chain: 249 strikes per side, greeks stamped 20:00 ET on October 26.
- Open interest as published in that chain: 612,637 calls and 1,648,282 puts.
- Window: strikes from 690 to 840, roughly ±10% of spot. Quoted IVs outside that band are unreliable. 147 strikes carry open interest inside it.
The put-to-call open-interest ratio on this expiry is 2.7 to 1. That imbalance is why the net number is negative even though calls and puts carry nearly the same gamma at each strike.
Step 2: gamma for one strike
Take the 765 call. Its quoted IV is 16.87%, so d₁ works out to 0.0362 and φ(d₁) to 0.39868. Then:
Γ = 0.39868 / (765.37 × 0.1687 × √0.010959) = 0.0295
One contract therefore carries 0.0295 × 100 × 765.37 = $2,258 of delta per 1-point move. Across 5,232 contracts that is $11.8M.
The 765 put carries 44,475 contracts at 16.67% IV and a gamma of 0.0298, so its contribution is -$101.6M. Net at that strike: -$89.8M per point. Same strike, same formula, opposite sign, because of the ownership convention.
Step 3: sign the legs and sum by strike
Put-call parity makes gamma identical for a call and a put at the same strike and volatility, so the plus or minus in a GEX total is an ownership assumption, not a property of the Greek. The common convention assumes dealers are long calls and short puts. Flip that one scalar and every regime label inverts while the magnitudes look untouched. Always state the sign convention next to the number.
Around spot, in $M of delta per 1-point move (call / put / net):
- 745: +2.2 / -133.3 / -131.2
- 750: +5.4 / -57.4 / -52.0
- 755: +2.2 / -238.9 / -236.7
- 760: +11.0 / -71.8 / -60.8
- 765: +11.8 / -101.6 / -89.8
- 770: +31.0 / -25.1 / +5.9
- 775: +17.6 / -5.9 / +11.7
- 780: +31.2 / -4.2 / +27.0
- 785: +12.8 / -0.1 / +12.7
Across the 690 to 840 window, net GEX is -$594.9M per 1-point move, or -$4.55B per 1% move. Negative net gamma means modeled hedging that sells into weakness and buys into strength.
Summing across expiries is the same step repeated. Keep the per-expiry totals first, then add them, so a single front-expiry strike cannot hide inside the aggregate. The figures above are one expiry; a full-chain number includes every series you choose to count, and that inclusion choice is one of the forks below.
Step 4: find the flip by repricing the chain
A strike-level sum reuses gammas computed at one spot. The flip is a different object: the spot where the repriced portfolio's net gamma crosses zero. You find it by re-running the entire calculation across a grid of hypothetical spot prices, holding each contract's IV and open interest fixed, then looking for the sign change nearest the current price.
Stepping spot from 690 to 840 in $0.50 increments on this chain:
- 760: -$863.6M per point
- 765: -$615.7M at the grid node, against -$594.9M at the 765.37 close
- 770: -$316.4M
- 775: -$6.5M
- 780: +$266.0M
The only crossing is between 775.00 and 775.50. Linear interpolation puts the flip at 775.11, about 1.3% above spot. Below it, modeled net gamma is negative. Above it, positive.
Two cautions. Holding IV fixed is an assumption: a real move reprices the surface, and a volatility spike can move the flip. And a flip computed by accumulating strikes from the bottom of the chain is not this number. That method lands wherever distant put open interest happens to swamp the running sum, which can be hundreds of points from spot.
Step 5: locate the walls
The call wall is the strike with the largest positive GEX. The put wall is the strike with the largest negative GEX. On this snapshot:
- Call wall: 780, at +$31.2M per point on 26,296 contracts. The 770 strike is +$31.0M, within 1%, so read 770 to 780 as one zone rather than a single magnet.
- Put wall: 755, at -$238.9M per point on 150,938 contracts. The next largest is 745 at -$133.3M.
A wall is a concentration of modeled positioning, not a promise. It marks where hedging flow would concentrate if the chain's open interest were held by dealers in the assumed direction. Price can respect it, slice through it, or never reach it. Our wall guide covers how to judge which one is happening.
How do you audit a vendor's gamma exposure number?
Compare conventions before you compare totals:
- Chain timestamp and open-interest session. A 20:00 ET snapshot and a 09:35 ET snapshot are different datasets.
- Expiries included. One expiry and a full term structure produce different flips and different walls.
- Multiplier. 100 for SPY and SPX.
- Units. Dollars per 1 point or per 1%. At 765, the per-1% total is 7.65 times the per-point total.
- IV source. Per-strike mid IV, a fitted surface, or one ATM number.
- Sign model. Calls positive and puts negative is an assumption, not a measurement.
- Strike window. Deep wings with junk IV can add phantom gamma to the total.
The four forks that move the number
Two dashboards can print different flips on the same tape and both be internally consistent. The divergence usually comes from four choices:
- Weighting. Open interest weights accumulated positions; volume weights today's activity. On 0DTE names, where the day's prints dwarf the overnight position, the two produce different walls and a different flip.
- Spot or forward. Hedging to spot and hedging to a rate- and dividend-adjusted forward shifts the flip, by a few index points on SPX and less on SPY.
- IV source. Per-strike mid IV, a fitted surface, or one ATM number. That choice alone moved net GEX 15.5% in the snapshot above.
- Expiry inclusion. Whether same-day expiries count, and which open-interest session they use. This is the largest 0DTE fork.
When two reads disagree, match one fork at a time in your own sheet before deciding that one is wrong.
One finding from this snapshot is worth repeating. Recomputing gamma from each contract's printed mid IV did not exactly reproduce the chain's own gamma column. Across the 61 strikes within 30 points of spot, the median absolute difference was 3.1% and the worst was 24.6%. Two columns from the same vendor can disagree at that level, so recompute from IV and open interest, and compare convention first and number second.
How does 0DTE open interest distort the profile intraday?
Open interest is a position count the exchange publishes after the close. On a same-day expiry, the figure you start the session with reflects yesterday's positions, while the contracts that will matter by midday are still being opened. The morning number therefore understates the front-expiry gamma that will exist by the close. The volume is real; the open interest attached to it is not there yet.
Two consequences follow. A profile built from overnight open interest is an opening estimate, and the flip can migrate toward spot as the day's positions build. A volume-weighted front-expiry estimate reacts faster but is noisier, because it counts activity, including contracts that open and close within minutes.
Whichever you use, timestamp the open-interest session separately from the chain timestamp. A chart that refreshes spot and IV while reusing yesterday's open interest is repricing an old book. That is a legitimate estimate, but it is not a live positioning read. Our 0DTE gamma landscape covers how the front expiry changes the regime read.
A spreadsheet wins on auditability and loses on latency. A paid dashboard wins on coverage and refresh rate and hides its forks. Neither is more correct by construction; the checklist above is how you tell them apart.
What the calculation cannot tell you
- Open interest has two sides. Assuming dealers are long every call and short every put is a convention, not observed inventory.
- The flip grid holds volatility fixed. In a fast move the surface changes and the flip moves with it.
- This is one expiry. SPY's term structure and 0DTE flow are not in the number.
- It is not a forecast. Negative net gamma describes hedging that may amplify a move, not a move that will happen.
FAQ
Should gamma exposure be positive or negative?
Neither is good or bad. Positive net GEX describes hedging that dampens movement, negative net GEX describes hedging that can amplify it. The sign depends on the chain and, critically, on the dealer-positioning assumption you adopted.
Does the gamma flip predict direction?
No. It marks where the estimated hedging response changes sign. Price can reverse at the flip, accelerate through it, or ignore it. Treat it as a regime marker that needs confirmation from price behavior.
Why does my number differ from a dashboard's?
Usually one of five reasons: a different open-interest session, a different expiry set, a different IV source, a different unit convention, or a different dealer-sign model. IV handling alone produced a 15% difference on the snapshot above.
Is gamma exposure calculated with volume or open interest?
Both are used, and they answer different questions. Open-interest weighting measures accumulated positioning and is the standard convention. Volume weighting measures today's activity and reacts faster, at the cost of counting activity, including contracts that open and close within minutes. On 0DTE names the two can disagree sharply.
How often does dealer gamma exposure change during the day?
Spot, implied volatility and time to expiry move continuously, so every repriced input changes dollar gamma even when open interest is static. The open-interest input itself updates overnight. A 15-minute refresh is a practical floor for intraday use; a morning snapshot is not a midday read.
Can I build a free gamma exposure chart without a paid vendor?
Yes. Cboe publishes delayed chains with open interest, and a broker API gives you the same columns. The cost is your time and refresh discipline. What you do not get is a vendor's latency, full-chain coverage or flow overlays.
Does gamma exposure work on single stocks?
The arithmetic is identical for any optionable US name. The inputs are weaker: fewer strikes carry real open interest, spreads are wider, and single-name dealer positioning is less consistent. The flip and the walls are noisier and deserve wider error bars than SPX or SPY.
Educational content only. The snapshot above is dated and will not describe the next session. It is a worked example, not a signal or investment advice.
See why two GEX tools can show different levels for a controlled comparison using the visible expiries on a recorded SPY map.