
Which Expiry Is Driving SPY’s Gamma?
Read a recorded SPY gamma surface by strike and expiry. Find the contracts driving each level and see what changes when one expiration is removed.
The expiration driving a gamma level can change from one strike to the next. Pick the strike you care about and read across that row. A total for the whole chain can hide the difference between a level concentrated in one expiration and a level supported by several.
How do you find the expiry behind a level?
Open this SharkQuant SPY surface capture, saved October 17, 2026. The display shows five expirations, from October 19 through October 23, and an estimated exposure scale of dollars per 1% move in spot. Displayed spot is $763.25. The date refers to the capture.
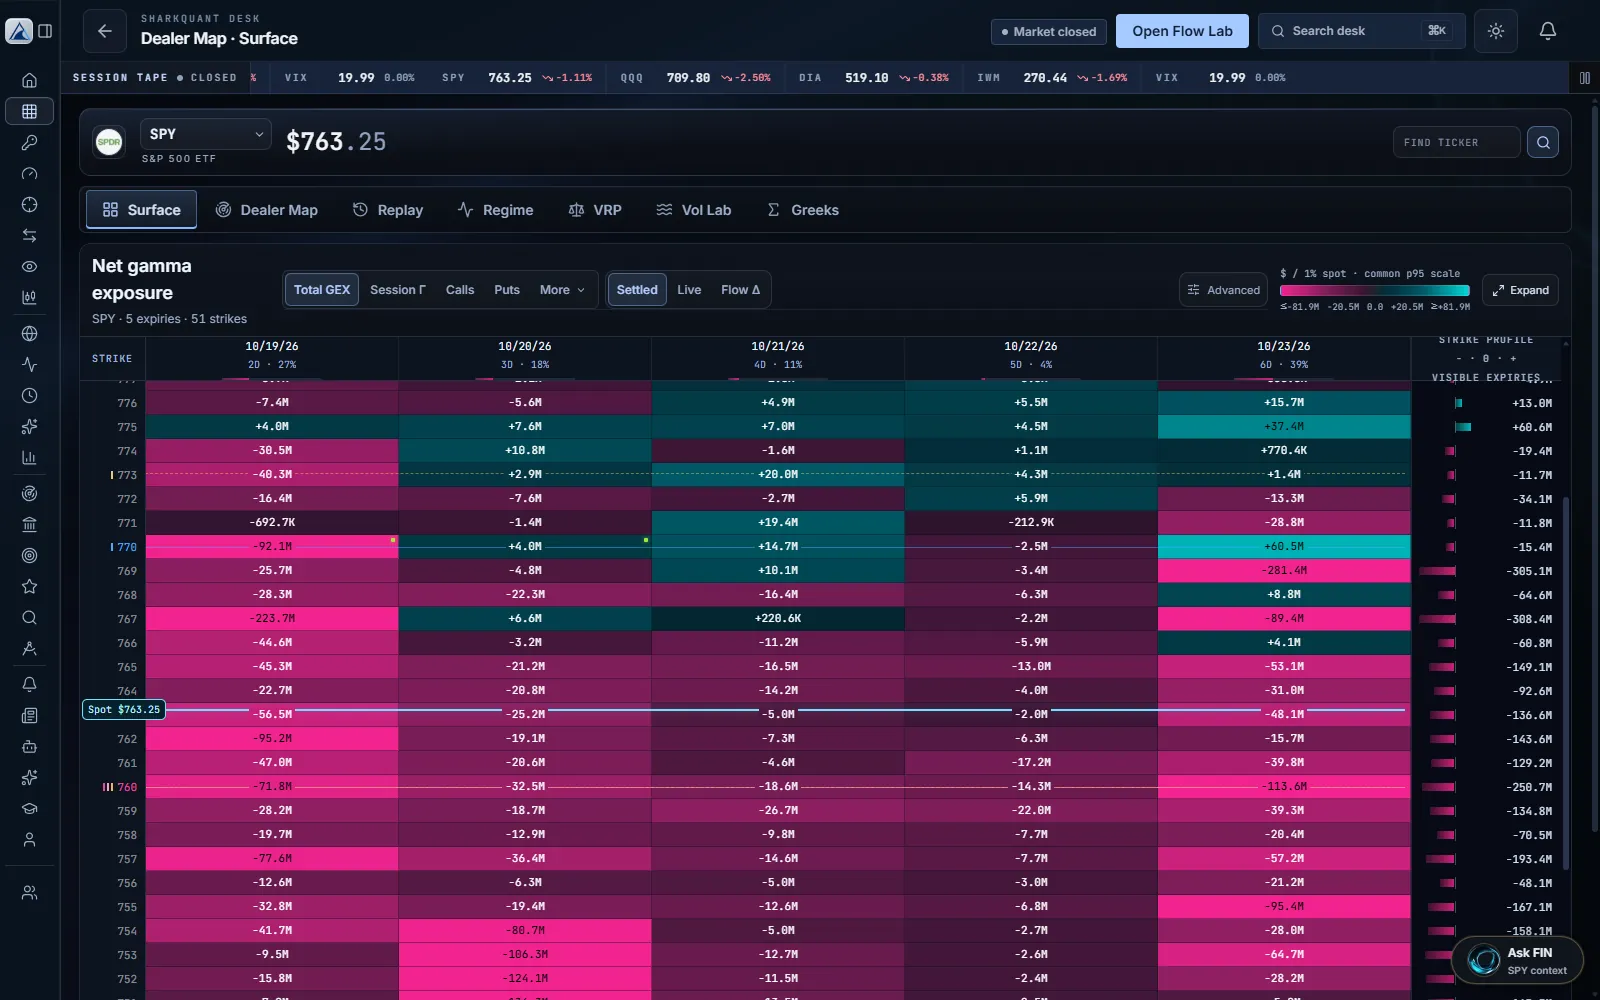
Read these two neighboring strikes:
- 767 strike. October 19 shows −$223.7 million and October 23 shows −$89.4 million. October 19 is the largest absolute cell in the row. The three intervening expirations are much smaller.
- 769 strike. October 23 shows −$281.4 million. October 19 shows −$25.7 million, and October 21 contributes +$10.1 million. At this strike, October 23 is the larger driver.
The desk’s strike profile shows net exposure near −$308 million at 767 and −$305 million at 769. Those totals look similar. Their expiry breakdowns tell you which part of the chain to recheck first.
What happens if you drop the largest expiration from each row?
At 767, taking the October 19 contribution out of the displayed net leaves roughly −$85 million. At 769, removing October 23 leaves roughly −$24 million. These are mechanical differences using rounded values. Spot, time to expiry, implied volatility, and positions can all change in a fresh chain.
Use the exercise to answer a specific question. Would the strike still stand out if the largest expiration were excluded? A level that survives the filter has support from the remaining contracts under that calculation. A level that shrinks sharply deserves a new check as the dominant expiry approaches settlement.
What should you check before using the level again?
- Mark the strike and the expiry responsible for the largest absolute contribution. Note the sign on that cell.
- Look for offsetting signs in the other columns. A small net figure can contain large opposing exposures.
- Record the observation time and the contracts included. Reopen the map when the chain refreshes or the expiration leaves the window.
- Compare the fresh row with price. Update your interpretation if the concentration moves or fades.
This example covers the five expirations visible in the capture. It does not rank unseen expirations or measure actual dealer inventory. Read the GEX heatmap guide for the axes and why two tools can disagree for an example where the expiry filter changes the sign.
Source: SharkQuant’s dated product capture. Educational analysis using historical data.