
Why Two GEX Tools Show Different Levels
Use one recorded SPY gamma map to see how expiry filters change net exposure, then reconcile units, open interest, and dealer-sign assumptions.
Two gamma exposure tools can agree on every cell of an options chain and still give you different levels. The quickest way to find the reason is to match the contracts they include. Then check the units, the age of the inputs, and the assumptions used to assign dealer exposure.
How can one expiry change the sign at the same strike?
Open the recorded SharkQuant SPY surface. The capture is dated October 17, 2026. It shows a settled view with spot displayed at $763.25 and five visible expirations from October 19 through October 23. The legend expresses estimated exposure in dollars per 1% move in spot. The capture date describes when the screen was saved.
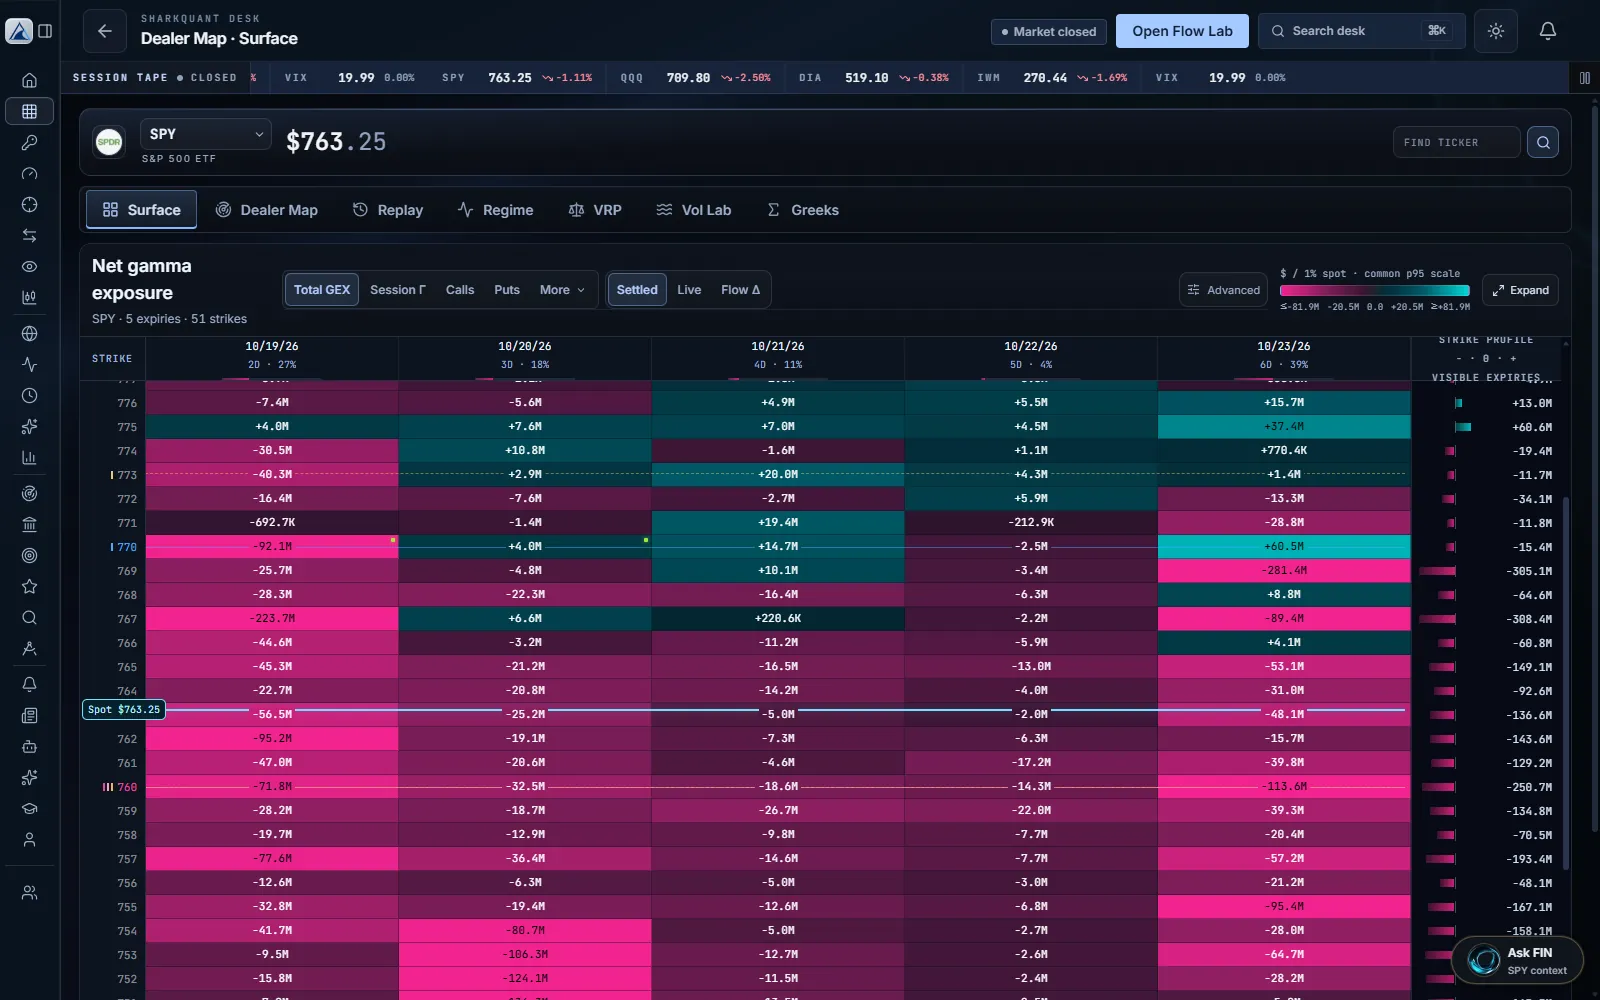
At the 770 strike, the October 19 cell shows −$92.1 million and October 23 shows +$60.5 million. The three intervening columns show +$4.0 million, +$14.7 million, and −$2.5 million. Summed across the five visible expirations, the displayed figures come to about −$15.4 million.
Leave out October 19 and sum the same four remaining cells. The result is about +$76.7 million. This is a filter exercise on rounded values from the capture. It holds the pricing inputs fixed and shows why the same strike can read differently across expiry windows. It does not model what happened once those contracts expired.
What should you align before comparing two tools?
- Contract set. Match the ticker, expirations, strike range, and session. For index options, check the settlement series as well. A same-day view and a monthly view answer different questions.
- Units. Compare dollars per 1% move with the same unit. If a source reports dollars per one-point move under the same convention, multiply by 1% of spot to express it per 1%. At spot $763.25, that multiplier is 7.6325.
- Input times. Record the open-interest date, spot timestamp, and Greek or volatility timestamp separately. Repricing the last published open interest with a new spot price can change estimated exposure even with the same position counts.
- Dealer sign and level definition. Public open interest counts outstanding contracts. The model supplies the dealer sign. Check whether a wall is selected by net GEX, one option side, or open interest, and whether a flip is obtained by repricing the chain across spot levels.
What should you do when the levels still disagree?
Write down which assumption would explain the gap. If the providers publish enough inputs, remove one difference at a time. If a definition is unavailable, keep each level tied to its source and use it as a conditional reference. An average of two differently defined flips has no clear interpretation.
SharkQuant’s dealer map lets you inspect the strike and expiry breakdown before leaning on the aggregate. Start with the gamma exposure desk, or work through the math in the SPY chain calculation. For the next step, see how to identify the expiry driving a strike.
Sources: SharkQuant’s dated product capture and Cboe’s SPY options chain reference. Educational analysis using historical data.