
Volatility Skew Explained: Why OTM Puts Cost More
Equity index options rarely price the same implied volatility at every strike. What the smile and skew are, why downside protection carries a premium, and what a steepening skew does not tell you.
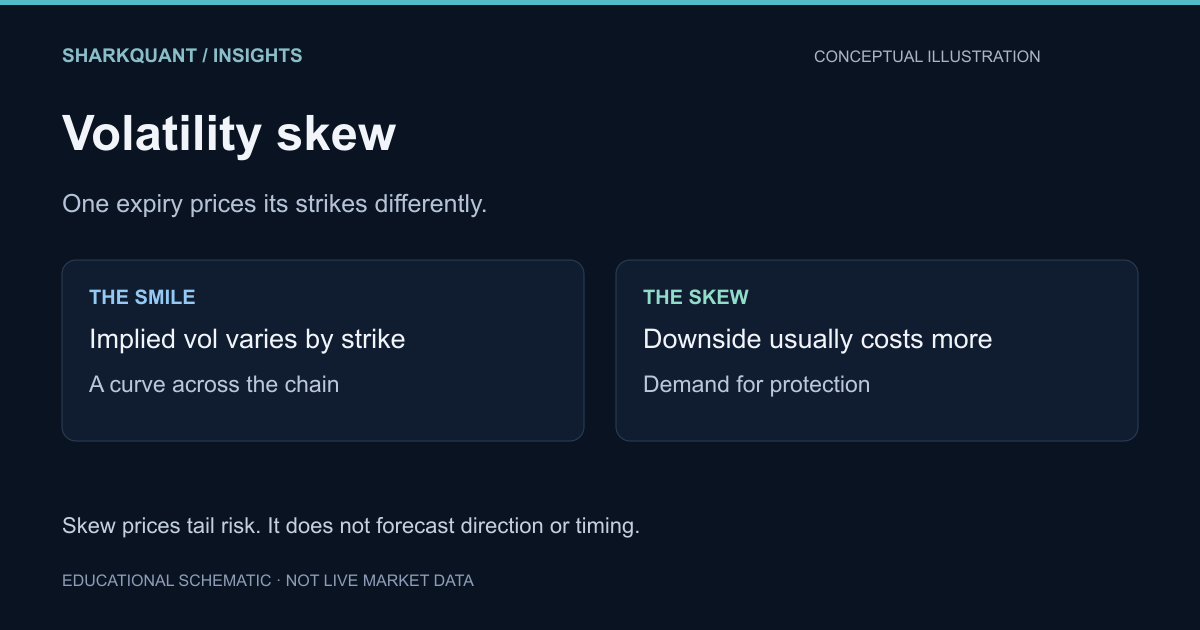
A flat implied volatility surface would imply that the market prices the same uncertainty for a strike 5 percent below spot as for one 5 percent above. It does not, and the shape of that difference is one of the most informative prices in the options market.
The smile and the skew
Plot implied volatility against strike for a single expiry. For equity index options the result usually slopes: high for far out-of-the-money puts, lower toward the money, and typically lower again for equidistant calls, though it often turns back up in the far upside strikes. The general U-shape is the smile. The asymmetry, with the left side sitting higher, is skew, and in equity indices it is usually negative.
So a 10-delta put and a 10-delta call on the same expiry are not priced at the same implied volatility. The put is priced higher. In volatility terms, downside is more expensive than upside.
Why the asymmetry exists
Three forces do most of the work, and they compound.
Hedging demand. Institutions own equity. The cheapest way to buy protection against a sharp decline is to own out-of-the-money index puts. Persistent demand for a limited supply of downside insurance bids those strikes up.
Leverage and convexity preference. A small position in far out-of-the-money puts offers a large payoff in a crash. Buyers are paying for a convex payoff, and sellers demand compensation for the negative skew they take on. The same reasoning that explains the variance risk premium explains why its cost concentrates in the tail.
Dealer inventory. Market makers who are net short downside puts carry a position whose delta grows quickly in a selloff. They price that risk into the strikes they are most exposed to, then hedge it, which feeds back into the surface.
None of that is sentiment. It is the price of transferring a specific risk, and it persists because the risk is real.
Reading the surface
Skew is a shape, so read it as a shape and not as a level:
- Steepening means downside strikes are getting relatively more expensive. Either hedging demand has risen, or dealers are charging more to warehouse it, or both. It frequently accompanies nervous markets, and it frequently precedes calm ones.
- Flattening means downside is getting cheaper relative to the money. That can mean genuine confidence, or crowded call demand in a melt-up, or a supply of premium from systematic sellers. The surface does not tell you which.
- Convexity in the far wing is where crash pricing lives. A handful of tails repricing is a different signal from the whole left side lifting.
Cboe publishes a summary statistic for this: the SKEW Index, which estimates the skewness of S&P 500 returns at the end of a 30-day horizon and typically ranges between 100 and 150. It is a convenient shorthand for "how much tail risk is priced," and it is a pricing measure, not a forecast. A high reading says the market is charging a lot for tail protection. It does not say a crash is coming, and it can stay high for months.
What skew does not tell you
This is where most skew commentary goes wrong.
Skew contains no timing information. It describes relative prices across strikes for a given expiry. Getting direction or a date out of that requires an assumption the surface never made.
Skew can be expensive and stay expensive. If you sell the far put because it looks rich, you are short a convex payoff in the exact scenario that the price is compensating you for. Richness is not an edge until you can say what would make it converge, and by when.
Skew is also entangled with gamma and vega. A steepening wing changes the vanna and charm profile of every position that touches those strikes, which changes how hedgers behave as spot moves. The vanna and charm guide covers those second-order effects. And when an event resolves, the whole surface can reprice at once, which is the mechanism behind IV crush.
A practical way to use it
Treat skew as a cost-of-insurance reading rather than a signal:
- Measure the implied volatility of a fixed delta on each wing, for example 25-delta put minus 25-delta call, on a consistent expiry.
- Track that difference over a year and note its percentile. Absolute numbers are not comparable across regimes; the distribution is.
- Compare the front expiry to the back. A front-loaded steepening is about an imminent event. A broad steepening across expiries is about the regime.
- When you structure a position, price it against the wing you are actually trading. A credit spread sold in the far put is a different business than the same spread sold near the money, even at the same width.
If you are buying protection, the honest question is whether the insurance is fairly priced against the risk you are hedging, not whether it is cheap relative to last month. If you are selling it, the honest question is whether the premium covers the tail you are now short, at your position size. Neither question is answered by the shape alone.
Bottom line
Skew is the market charging different prices for different risks in the same underlying. That is a useful measurement of what protection costs and where positioning is concentrated. It is not a directional forecast, and the most common misuse is treating a steep wing as a prediction rather than as a price.