
The VIX Term Structure as a Regime Input
Contango and backwardation describe how volatility expectations change across expiries. What the curve is built from, why its shape is a regime signal rather than a direction call, and how to use it without reading too much into it.
Most volatility discussion collapses into a single number: VIX is up, VIX is down, VIX is at 15. That number is one point on a curve. The shape of the curve carries information the level does not, and it is available for free.
What the index and the curve are
The VIX Index is a benchmark designed to estimate expected 30-day volatility of the S&P 500, calculated from the prices of SPX options across strikes rather than from any single contract. Cboe applies the same methodology to other maturities to produce a family of gauges, including 9-day, 3-month, 6-month and 1-year versions. Plot those expectations against their horizons and you have an implied volatility term structure for the index, analogous to the yield curve in fixed income.
There is a second, related curve: VIX futures. Each future reflects the market's estimate of the index value on a specific expiration date. The relationship between futures prices and their maturities is the VIX futures term structure, and it is the one that matters if you trade anything built on VIX futures.
The two curves are not the same object. Index levels describe expectations of volatility over a window. Futures prices embed expectations plus the cost of carrying the position until that date. Confusing them is a common source of bad conclusions about what "the curve" is saying.
Contango and backwardation
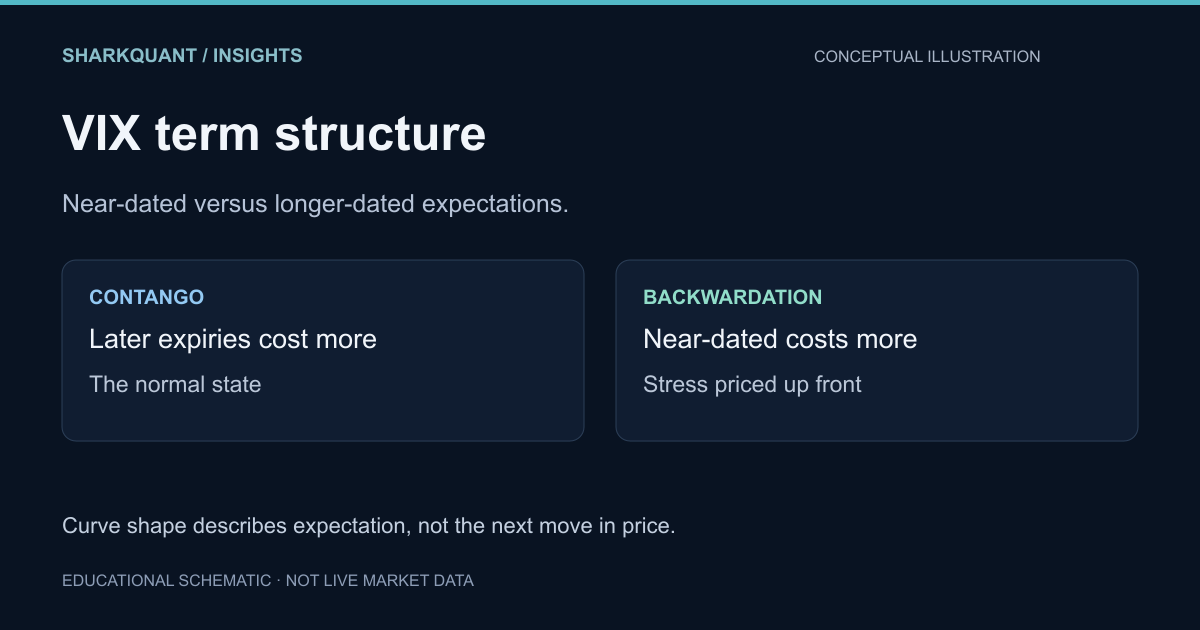
When near-dated expectations sit below longer-dated ones, the curve slopes upward: contango. This is the normal state. Cboe's own commentary on the subject notes the VIX futures curve has been in contango more than 80 percent of the time since 2010, which fits the mean-reverting nature of volatility: long stretches of calm punctuated by short spikes. Contango tends to be steepest when the spot index is very low.
When near-dated expectations sit above longer-dated ones, the curve slopes downward: backwardation. It means the market is pricing more uncertainty in the immediate future than further out, and short-dated hedging is expensive in volatility terms. Cboe notes backwardation has occurred less than 20 percent of the time since 2010, and that these episodes tend to be shorter than the contango periods that surround them.
The practical consequence for anyone holding a VIX-futures-based product is roll. In contango, a fund rolling from an expiring contract into a more expensive one loses value even if the index does nothing. In backwardation, the roll works the other way. This is a structural feature of the product, not a market opinion, and it is why a long volatility position can lose money while volatility rises.
Why the shape is a regime signal
The curve is a clean read on whether the market is pricing stress as near-term or distant. That makes it useful for context, sizing and expiry selection:
- Steep contango plus low spot suggests complacency is being priced. Short-dated optionality is comparatively cheap, and short-dated premium selling is comparatively crowded.
- Flattening is often the first sign that near-term risk is being repriced, before spot volatility moves much.
- Backwardation says near-term uncertainty dominates. Short-dated hedges are expensive, realized volatility is usually elevated, and any strategy short gamma in the front expiry is being paid less than the risk implies.
That is a regime description, not a trade signal. It tells you which expiry is expensive and which is cheap relative to the other. It does not tell you where the index goes.
What it fails to predict
Cboe's analysis of backwardation is worth reading precisely because it undercuts the popular reading. Backwardation has appeared around major drawdowns, but outside the largest selloffs the forward returns do not support the idea that backwardation reliably precedes a decline. Markets can recover quickly, and the best performance often follows the worst periods.
There is a mechanical reason to be careful. The curve is a price of insurance, and insurance gets expensive after people notice the hazard. Backwardation is partly a statement about demand for protection, not purely about expected variance. A market can be in backwardation because realized volatility has already spiked, which is a description of the present rather than a forecast of the future.
Building it into a read
A disciplined version looks like this:
- Compute a slope measure, such as the ratio of a longer-dated gauge to the 30-day index, and record it daily.
- Track where that ratio sits in its own one-year distribution. Level without percentile is noise.
- Combine it with realized volatility and with positioning context. A steep contango with compressed realized volatility and heavy positive gamma is a coherent regime description. Each piece alone is thinner.
- Change expiry selection, not direction, when the curve moves. The curve is best at telling you which part of the surface is expensive.
Positioning context is the natural companion. The gamma exposure explainer and the gamma flip guide describe the hedging regime that determines whether index moves get dampened or amplified, which is a different axis from the volatility curve but interacts with it.
Bottom line
The VIX term structure tells you whether the market is pricing stress as near or far, and therefore which expiries are expensive. That is genuinely useful for choosing what to trade and how to size it. It is not a forecast, and the most expensive mistake is treating a backwardated curve as a scheduled decline.