
Implied vs. Realized Volatility: How to Measure the Gap Honestly
Implied volatility is a price. Realized volatility is a measurement. Comparing them requires matching horizons and methods, and the resulting gap is compensation for risk rather than free income.
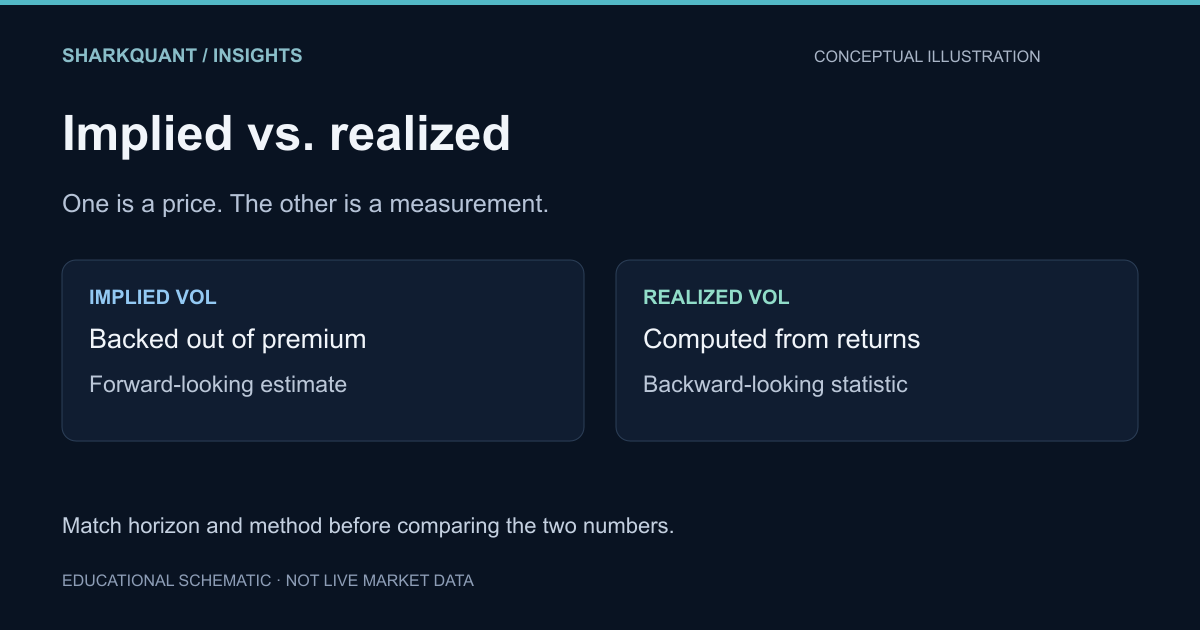
Almost every options argument eventually rests on a comparison between two numbers that look alike and are not. Implied volatility is a price, expressed in volatility units. Realized volatility is a statistic computed from past returns. Putting them side by side is useful, but only when you are honest about what each one measures.
The two definitions
Implied volatility is the volatility input that makes a pricing model return the observed market price of an option. It is not a forecast anyone published. It is the market's current price for uncertainty over the option's remaining life, backed out of the premium, and it moves when supply and demand for that specific contract moves.
Realized volatility is the standard deviation of observed returns over a chosen window, annualized. It is a backward-looking estimate, and it depends on decisions you make: which price series, whether you include overnight gaps, how many observations, and whether you use close-to-close or intraday ranges.
Those two definitions are not commensurable until you align them. Comparing a 30-day implied volatility to realized volatility measured over the last five sessions is not a comparison. It is two unrelated numbers in the same post.
Matching the comparison
A defensible comparison fixes four things:
- Horizon. Use implied volatility for an expiry roughly matching the realized window you will measure. A 30-day implied number belongs next to 30 days of subsequent returns.
- Price basis. Both should use the same kind of price. If implied volatility comes from an index option priced off settlement, measure realized volatility off the same underlying convention rather than a different instrument's closing print.
- Annualization. Daily standard deviation multiplied by the square root of the number of trading days per year. State whether you assumed 252 or something else, because the difference shows up in the third digit and people argue about it as if it were signal.
- Overlap. Overlapping windows produce autocorrelated observations. That does not make them wrong, but it does mean your effective sample is smaller than the observation count suggests.
There is a further refinement worth knowing about. Close-to-close volatility discards intraday information, and a single gap can dominate the estimate. Range-based estimators use the open, high, low and close and are more efficient, at the cost of assuming the underlying follows a reasonably continuous process. Different estimators of the "same" realized volatility can differ enough to change whether a trade looks attractive, which is a warning about precision rather than an argument for one estimator.
The gap has a name and a reason
Implied volatility tends to exceed the realized volatility that subsequently occurs, on average. That difference is the variance risk premium. It is the compensation a seller of volatility demands for accepting a payoff that is negatively skewed: small steady gains most of the time, occasional large losses when volatility spikes.
That shape is the whole point. The premium is not a pricing error and it is not free income. It exists because the seller is short a convex payoff, and the average positive gap is compatible with severe drawdowns in the tail. Any strategy that harvests the premium looks excellent on a mean-return chart and can still be ruinous at the position-sizing level.
The reverse error matters too. When implied looks cheap against recent realized volatility, the temptation is to buy. But recent realized volatility is a small sample, and volatility clusters: a quiet stretch is not evidence that the next stretch is quiet. Buying premium because the last two weeks were calm is a bet that the clustering has stopped.
A workflow that survives scrutiny
Instead of one number against one number, build a small table:
- Implied volatility by expiry for the strikes you would actually trade, not just at the money.
- Realized volatility estimated over several windows (5, 10, 20, 60 sessions) with one stated method.
- The ratio of implied to each realized estimate, plus where that ratio sits in its own one-year distribution.
- The event calendar over the option's life, since scheduled events are exactly what implied volatility is pricing.
The distribution position does most of the work. A ratio of 1.2 means something different at the 90th percentile of its own history than at the 20th. Raw "IV is 22 percent" tells you nothing about whether that is expensive.
This is also where skew and term structure belong. A single at-the-money implied number hides that out-of-the-money puts may be priced very differently from equidistant calls, and that the whole surface may be sloping across expiries. The skew explainer and the VIX term structure guide cover those two dimensions.
Where the comparison breaks
Three failure modes are common enough to name:
- Stale inputs. A quote that has not traded is a guess, not a price. Wide markets with no volume produce implied volatilities that look precise and are not.
- Wrong instrument. SPX and SPY implied volatilities describe related but distinct exposures, with different settlement and different liquidity. Do not mix them as if they were interchangeable.
- Horizon mismatch dressed up as edge. Selling a 45-day option because 10-day realized volatility is low is not a variance risk premium trade. It is a bet that the next 45 days resemble the last 10.
Bottom line
Implied and realized volatility answer different questions: what the market charges for future uncertainty, and what uncertainty actually occurred. Compare them with matched horizons and stated methods, treat the average gap as payment for tail risk, and use the ratio's own history as the reference. A number without a distribution beside it is decoration.